ST03N : The chapter for all BASIS Admins

This blog is targeted to BASIS ADMINS

Transaction for workload analysis statistical data changed over time are monitored using transaction code ST03 , now ST03N (from SAP R/3 4.6C) . With SAP Web AS 6.4 the transaction ST03 is available again.

From time to time ST03 and ST03N has seen many changes but later in SAP NW7.0 ST03N has reworked in detail specially processing time is now shown in separate column.

Main Use of ST03N  is to get detailed information on performance of any ABAP based SAP system. Workload monitor analyzes the statistical data originally collected by kernel.

You can compare or analyze the performance of a single application server or multiple application server. Using this you start checking from the entire system and finding your way to that one application server and narrowing down to exact issue.

By Default :- You see data of current day as default view , you can change the default view.


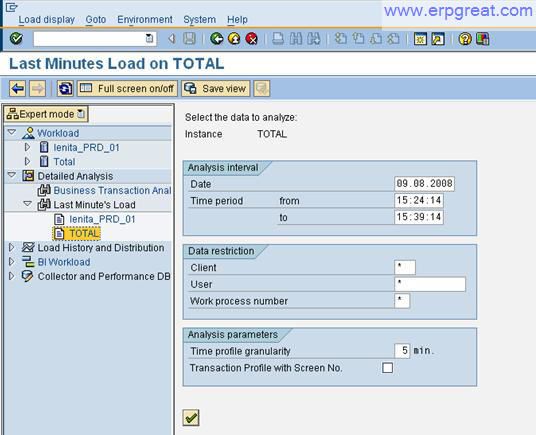
Source of the image : sap-perf.ca

Let's discuss the WORKLOAD MONITOR

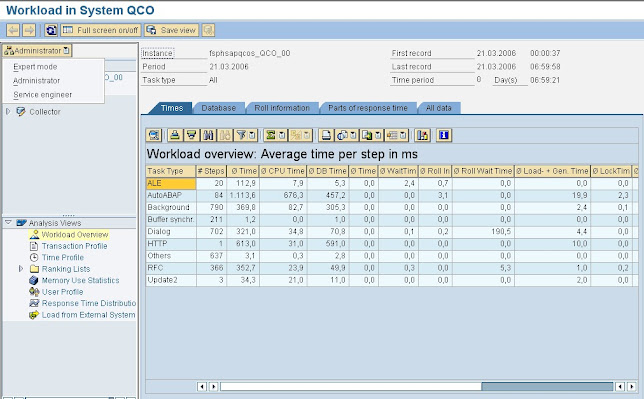
By Default : Expert mode needs to be used

As you can see in the picture you have all the data in second or millisecond as unit.

The common way to start analyze the issue is looking into workload monitor ,

So you need to check the overview in this flow , Check for Today , Last Minutes Load, Transaction profile and the response time duration, Total workload option , gets data from the whole SAP System.

Now Lets understand the different monitors that are used and their uses,


 So we need to check in expert mode , because hey we are the basis guys!

WORKLOAD : Two levels of analysis : Individual (Only one Application server) or Total/ALL (All Application server)

All configured Application servers of the SAP System are listed , even when application server is temporarily shutdown.

The other sub views are Day, Week and Month. So that we can check the performance problem of the past easily.


DETAILED ANALYSIS : Business transaction analysis is STAD , this is the successor of STAT which is no longer supported .

This displays workload statistics for every step executed in ABAP based system

As we can see in the below mentioned image we have 3 display mode :-

1. Sorted by time : Display Single records.

2. Grouped by business transaction : Shows all record , grouped by business transaction.

3. Show Business transaction tots : Display single records grouped by business transaction or jobs.


We can set the Read Interval if we want it displayed for a specific time interval.

We have different filter parameter , you can select a user , business transaction or different parameter can be used.

We can use different filter parameters as per our goals.

All records are read but only selective are displayed.  

Usually you will be working using the view , Show all stats records, Sorted by time.

Now [*] the option include statistics from memory , The System Analyzes that are not yet written in stats file but which are stored in the stats of buffer. This is must when you need to analyze the recent periods i.e. buffer records is included in this case. 

Server Selection allows you to analyze the stats of selected servers of the SAP System.

With AS ABAP 7.02 the transaction STADWD became available. STADWD implements the functionality of STAD using web Dynpro of ABAP.

If you did not receive data from a server that was called as a result of RFC problem or busy AS that increases 

Adding here is Another option Last minute's Load again you can either choose a an individual application server or a total summary.


You have Analysis Interval : Read interval [Date, Time]

You can also have data restriction : Filter Parameter [Client, Username and Work process number ]

The granularity of the time interval is determined. This granularity is used in the analysis view Time Profile.

LOAD HISTORY AND DISTRIBUTION : 

In this also you will have two views : Individual and Total application server, which can be displayed by date , week or month or any time period i.e. different time interval can be analyzed. 

By default only DIA (Dialog task types) are listed but obviously others can also be seen.

You can also check users per instance along with a cumulative view.

BI WORKLOAD :

Business Warehouse capabilities of Netweaver is checked here.

Schedule corresponding collector that gathers respective information about the workload caused by Business Warehouse functions in SAP System.

COLLECTOR AND PERFORMANCE DB :

1. Performance Database

2. Performance Monitor Collector

    - access to log files of report RSCOLL00 that collects the data as per scheduling mentioned in table TCOLL

3. Workload Collector 

    - Customize the workload collector , for example how many records to collect during a run.

4. Statistics records and files : Here you can look up and change SAP System Parameters relevant for collecting statistics data.


Let's understand the ANALYSIS VIEW 

We can see different Analysis views present in ST03 that is present in  the left pane.


So as you see the second half Analysis View :

Workload View : By Default it shows for today you can customize this setting. This gives you a rough idea what is the issue with performance in normal scenario.

Transaction Profile :  This helps you find the most used transaction , Sort as per the total response time , number of steps.

As an admin , we need to focus on transactions that have the largest total response time as we need to tune these . We need to understand that these transaction will have the major impact on SAP System performance.

We need to inspect the average response time for transactions.

Two categories : Standard and Early watch.

In this we need to analyze the transactions that are affected and that needs to be changed 

Standard : All available aggregation types and analysis views.

Early Watch : Only offers a sub-set function 


Source - sap-pref.ca

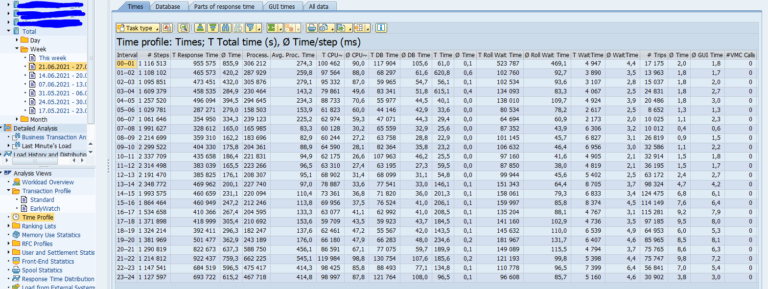
Time Profile : Statistical data of chosen task is displayed segmented according to granularity level and time interval you specified.

source : saptechnicalguru.com


Ranking Lists : You can find the top 40 executed steps executed within the SAP System , according to task types and differentiated between 

1. Response time

2. Number of database calls 

3. Memory use statistics "Average total memory usage [kB]"

and you can again differentiate between task type.


RFC Profile : Statistics of separate client side and server side RFC activities of the SAP System, you can look up for :-

1. client and server destination

2. users

3. called function blocks

and more 


User and Settlement Statistics : User and client activity

Front end statistics : Activity statistics by front end

Spool Statistics : for print related loads.

Response time duration : Response time in the SAP Application server are distributed . Used for monitoring SLAs. For instance someone guarantees an average response time of DIA as 3s or better.

Load from External System : For External System Activities.

Web Statistics : related to web reporting caused by Business Intelligence Activities.

DB Connection Statistics : Stats regarding DB access , differentiated by DB user . Major load is caused by connection "Default" 


In the next blog we will dive deep in how we analyze the workload.

Comments

  1. Great post! I found ST03.net quite useful as well.

    ReplyDelete
  2. Where can we found next blog?

    ReplyDelete
  3. Great blog!. Looking forward to post more blog like this . custom erp development in chennai

    ReplyDelete

Post a Comment

You might find these interesting

How to properly Start/Stop SAP system through command line ?

Starting/stopping an SAP system is not a critical task, but the method that most of us follow to achieve this is sometimes wrong. A common mistake that most of the SAP admins do is, making use of the 'startsap' and 'stopsap' commands for starting/stopping the system.  These commands got deprecated in 2015 because the scripts were not being maintained anymore and SAP recommends not to use them as many people have faced errors while executing those scripts. For more info and the bugs in scripts, you can check the sap note 809477.  These scripts are not available in kernel version 7.73 and later. So if these are not the correct commands, then how to start/stop the sap system?  In this post, we will see how to do it in the correct way. SAP SYSTEM VS INSTANCE In SAP, an instance is a group of resources such as memory, work processes and so on, usually in support of a single application server or database server with

sapstartsrv is not started or sapcontrol is not working

 What is sapstartsrv ? The SAP start service runs on every computer where an instance of an SAP system is started. It is implemented as a service on Windows, and as a daemon on UNIX. The process is called  sapstartsrv.exe   on Windows, and   sapstartsrv   on UNIX platforms. The SAP start service provides the following functions for monitoring SAP systems, instances, and processes. Starting and stopping Monitoring the runtime state Reading logs, traces, and configuration files Technical information, such as network ports, active sessions, thread lists, etc. These services are provided on SAPControl SOAP Web Service, and used by SAP monitoring tools (SAP Management Console,  SAP NetWeaver  Administrator, etc.). For more understanding use this link : https://help.sap.com/doc/saphelp_nw73ehp1/7.31.19/enUS/b3/903925c34a45e28a2861b59c3c5623/content.htm?no_cache=true How to check if it is working or not ? In case of linux , you can simply ps -ef | grep sapstartsrv In case of windows, you need

HANA System Replication - Prerequisites & Setup

Hey Folks! Welcome back to Hana high availability blog series. In our last blog we checked out operation & replication modes in hana system replication. If you haven't gone though that blog, you can checkout  this link In this blog we will be talking about the prerequisites of hana replication and it's setup. So let's get started. When we plan to setup hana system replication, we need to make sure that all prerequisite steps have been followed. Let's have a look at these prerequisites. HANA System Replication Prerequisites: Primary & secondary systems should be up & running HDB version of secondary should be greater than or equal to Primary database sever But, for Active/Active(read enabled config), HDB version should be same on both sites. System configuration/ini files should be identical on both sides Replication happe

HANA hdbuserstore

The hdbuserstore (hana secure user store) is a tool which comes as an executable with the SAP Hana Client package. This secure user store allows you to store SAP HANA connection information, including user passwords, securely on clients. With the help of secure store, the client applications can connect to SAP HANA without the user having to enter host name or logon credentials. You can also use the secure store to configure failover support for application servers in a 3-tier scenario (for example, SAP Business Warehouse) by storing a list of all the hosts that the application server can connect to. To access the system using secure store, there are two connect options: (1)key and (2)virtualHostName. key is the hdbuserstore key that you use to connect to SAP HANA, while virtualHostName specifies the virtual host name. This option allows you to change where the hdbuserstore searches for the data and key files. Note

Unlock the Power of SAP HANA Performance Optimization: A Comprehensive Guide for SAP Basis Administrators [Part 2 : Deep Dive ]

In SAP systems, the performance of the underlying database plays a crucial role in delivering a seamless user experience. SAP HANA, being an in-memory database, offers exceptional speed and agility. However, it's essential to monitor and troubleshoot potential performance bottlenecks to ensure optimal system performance. In this blog post, we will explore key areas to focus on when monitoring the SAP HANA database and provide examples of how to identify and address common performance issues. Threads : Threads in the SAP HANA database represent individual tasks that execute concurrently. Monitoring thread utilization helps identify any thread-related issues, such as high thread utilization or thread exhaustion. You can use the M_SERVICE_THREADS table to gather information about active threads and their status. For example, a high number of waiting threads may indicate resource contention or blocking situations that require investigation and optimization To retrieve  thread based on

Work Process and Memory Management in SAP

Let’s talk about the entire concepts that are related to memory when we talk about SAP Application. Starting with few basic terminologies, Local Memory :  Local process memory, the operating system keeps the two allocation steps transparent. The operating system does the other tasks, such as reserving physical memory, loading and unloading virtual memory into and out of the main memory. Shared Memory :  If several processes are to access the same memory area, the two allocation steps are not transparent. One object is created that represents the physical memory and can be used by various processes. The processes can map the object fully or partially into the address space. The way this is done varies from platform to platform. Memory mapped files, unnamed mapped files, and shared memory are used.  Extended Memory : SAP extended memory is the core of the SAP memory management system. Each SAP work process has a part reserved in its virtual address space for extended memory. You can set

How to resolve Common Error : Standard Template "sap_sm.xls" missing

Hey everyone, putting forward a common error we usually face when we have “ Excel inplace” functionality enabled in our SAP system. This error occurs when validity of the signature of SAP standard templates expired or were incorrectly delivered via support packages. We can reproduce the error by doing as below.. Click on “spreadsheet” icon after any SAP ALV grid view of data is on screen to make this data to export into excel directly from SAP.

ABAP Dumps Analysis

Ever now and then have you heard about ABAP Dumps, We also have a joke everything in temporary in life except ABAP dumps for SAP Consultants. Lets try to understand ABAP dumps from perspective of a SAP BASIS Consultant. Dumps happen when an ABAP program runs and something goes wrong that cannot be handled by the program We have two broad categories of Dumps , In custom program Dumps and SAP provided program Dumps. Dumps that happen in the customer namespace ranges (i.e. own-developed code) or known as Custom Program , can usually be fixed by the ABAP programmer of your team. Dumps that happen in SAP standard code probably need a fix from SAP. You do not have to be an "ABAPer" in order to resolve ABAP dump issues. The common way to deal with them is to look up in ST22 How to correct the error ? Hints are given for the keywords that may be used to search on the note system. Gather Information about the issue  Go to System > Status and Check the Basis SP level as well as info

SAP application log tables: BALHDR (Application Log: Header Data) and BALDAT (Application Log: Detail Data)

  BALHDR (Application Log: Header Data): Usage : The BALHDR table stores the header information for application logs. It serves as a central repository for managing and organizing log entries. Example Data Stored: The table may contain entries for various system activities, such as error messages, warnings, or information logs generated during SAP transactions or custom programs. Columns Involved: LOGNUMBER: Unique log number assigned to each log entry. OBJECT: Identifies the object associated with the log entry (e.g., a program, transaction, or process). SUBOBJECT: Further categorizes the object. USERNAME: User ID of the person who created the log entry. TIME: Date and time when the log entry was created. ADD_OBJECT: Additional information or details related to the log entry. BALDAT (Application Log: Detail Data): Usage : The BALDAT table contains the detailed data for each log entry, linked to the corresponding entry in the BALHDR table. It stores the specific log details and me