
Understanding Splunk Monitoring : BLOG 1


This blog is nothing but my notes from Splunk admin training available on Linkedin Learning by Josh Samuelson , System Admin and DevOps Engineer.

This will be a series of 5 blogs :-

1. Understanding Splunk 

2. Search 

3. Reporting and Dashboard

4. Alerting

5. Practical Splunk 


So we use Splunk to monitor machine data and system logs.

What we can do with System Logs of Splunk : 

Collect , Search , Reporting , Visualizations and Alerting.

Collect : One of the major benefit of splunk is that , you can collect all of your data . No need to hunt for logs on multiple server and also gives you benefit of cross reference. Tracing issue from App server to Database server.

Search : A powerful way of searching which comes up with simple filtering and basic constraints along with advance Search context

Reporting Visualization and Alerting : Provides you with the functionality of generating simple reports and dashboards . Dashboards are nothing but data abstracted into simple graphs which helps you to understand pattern and reach to the root cause of any issue quickly and easily. Alerting is just setting the thresholds for which you need your team to be alerted which reduces the monitoring efforts.


Few Splunk Commands that is good to have :-

At the location : /opt/splunk/bin 

1. ./splunk start :- This command is used to start the splunk tool , at first go you need to read the terms and conditions and provide admin user and password when prompted. ]


2. ./splunk enable boot-start : Configure Splunk Enterprise to start at boot time

3. systemctl enable splunk : The enable command serves for executing the service since the initialization if consists of one or more units or unit instances. This will create a set of symlinks, as encoded in the [Install] sections of the indicated unit files. the system manager configuration is reloaded (in a way equivalent to daemon-reload), in order to ensure the changes are taken into account immediately. ) [SRC : GFG]  

Example : sudo systemctl enable name_service.service

4.systemctl enable splunk : The command start serves for starting (activate) one or more units specified on the command line.

Check Ip on which splunk is hosted ?


   You can get the IP on which splunk is hosted using ifconfig , and after that open any browser htttp://<IP on which splunk is being hosted>:8000.

    You can login in splunk using admin name and password that you must have filled during installation , In case of installation was done by someone else . You can always ask the admin to create an user for you.

Adding data to Splunk 

Before monitoring or creating alert for anything you need to add details of host for that you will see options here 


We have different options that we have to add in splunk 


Setting up splunk user ?


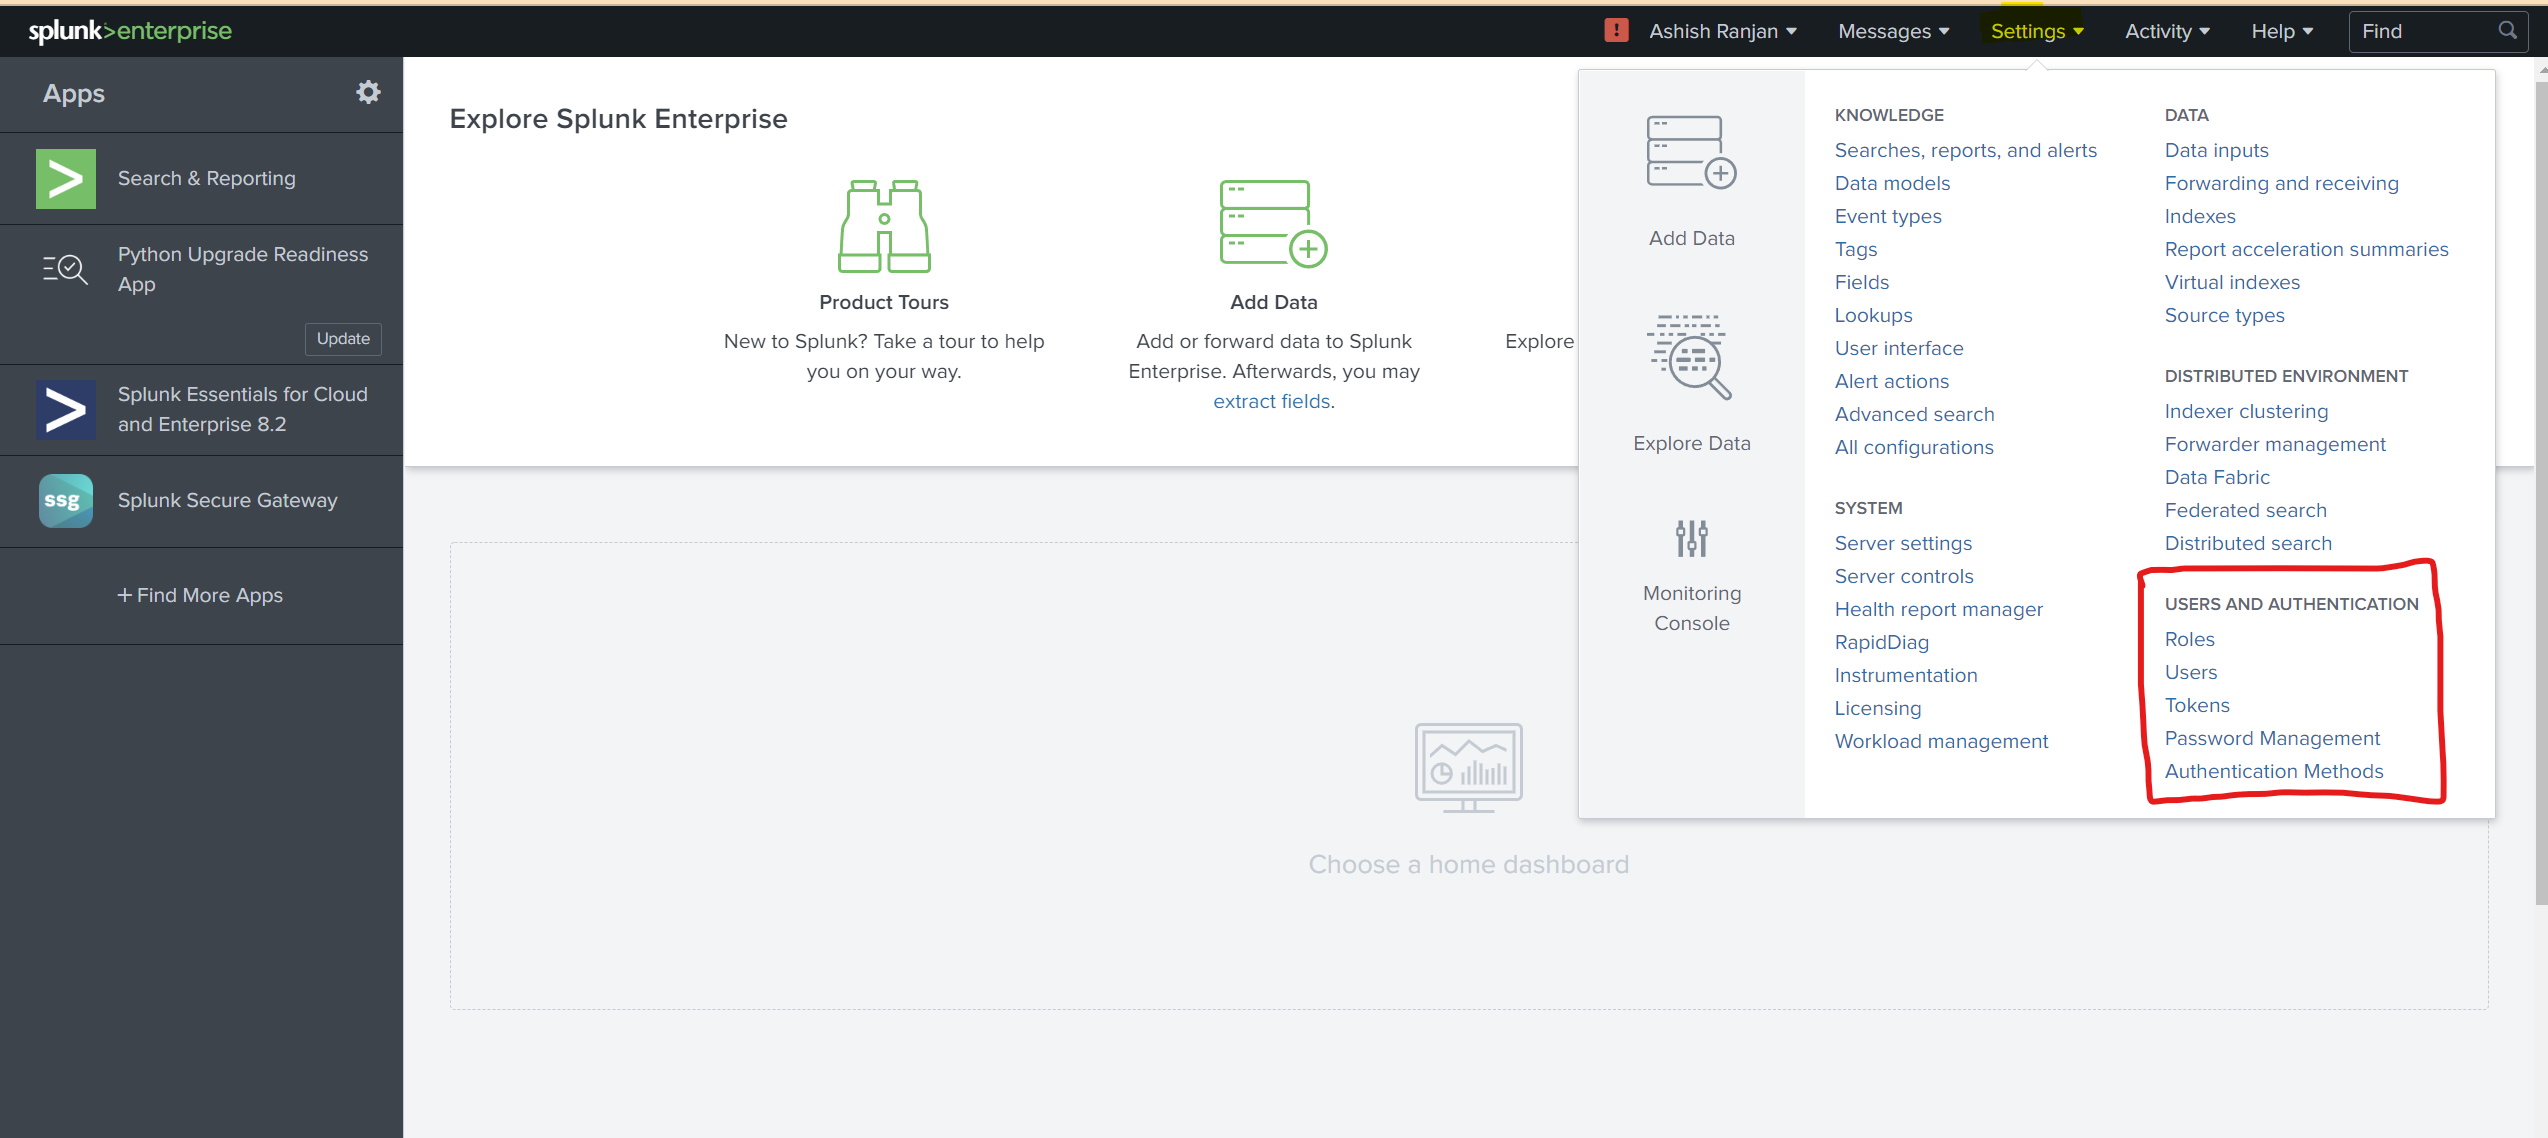
Once you are able to login , you need to go to see the setting and explore the options.

1. Users : will show all the different users that are present in the splunk account at that point of time.


You can see the green button "NEW USER"  in which you can add new user :-


Apart from role others are just basic or personal information that are required .

Let's discuss about the role.

Role : Role is just composite name assigned to a set of capabilities , which is nothing but action that can be performed by an user.

To create role we have two options 

1. Create a role based on the user being created :-

In the above image you can see that , you have an checkbox which say Create a role for this user

When you select multiple role for an user and you understand that the same set of role can be used in future for other user . you can make a role which has other roles in it.

E.g: You can assign admin, power, splunk-system-role , and other to one user and create a role which will have all these 3 already in one when creating new user.

2. Create a new role :- 

Go to Settings >  User and authentication > Roles


a. Inherit : You can inherit capabilities from an existing role 

b. Capabilities : You can add single single capabilities.

c. Indexes : Enable both the "Included" and "Default" checkboxes for an index to make that index searchable by default for this role. You must save this role before you can see its inherited wildcards.

d. Restrictions 

e. Resources

Apart from this you have option of 

Token : To set token based authentication .

Authentication Methods: You can add these different authentication method to make sure that you are using a protected and easy to use method , with the option of adding multifactor authenetication.


Password Policy Management : In this option you will have options to create a password policy which majorly depends on your organization and needs to be set as per the agreement they want to have.


Understanding the Search feature


You can directly search  in this tab and the result shows is split in time and event , which helps you have a better look.

with added feature like host from which that particular result is coming up , Source is the log file  and Source type is the log from where it is coming.


Diving in the Report Tab :-


Report tab already has a handful of reports that are used generally , reports is the filtered search data that make some sense and fulfill some agenda.

to understand it more clearly use open in search  option.


you are just filtering a search making and adding up time constraint to make some useful monitoring insights.


Connection between Search and Report 


What this particular report is doing is just searching Error failed or severe.

Manipulating the report feature :-


It is recommended that you never use the actual report that is initially present you have the option of clone in which you can perform the changes as per the customizations required.

You can clone change the description and title and work on the cloned report.


Edit Options 


Edit Schedule 


Add-Ons 

How to add addons in splunk can be understood in below slides , from adding these you can just utilize features that are their performing a small installation.


You can search and explore your options here 


You need to provide ID and Password for more understanding and then it will be in your system.

We will be giving you more blogs for splunk in coming future , Stay Tuned and let us know which topics related to splunk you need more information about.


Comments

  1. Great job for publishing such a nice article. Your article isn’t only useful but it is additionally really informative. Thank you because you have been willing to share information with us.
    Review Monitoring Services

    ReplyDelete

Post a Comment

You might find these interesting

How to properly Start/Stop SAP system through command line ?

Starting/stopping an SAP system is not a critical task, but the method that most of us follow to achieve this is sometimes wrong. A common mistake that most of the SAP admins do is, making use of the 'startsap' and 'stopsap' commands for starting/stopping the system.  These commands got deprecated in 2015 because the scripts were not being maintained anymore and SAP recommends not to use them as many people have faced errors while executing those scripts. For more info and the bugs in scripts, you can check the sap note 809477.  These scripts are not available in kernel version 7.73 and later. So if these are not the correct commands, then how to start/stop the sap system?  In this post, we will see how to do it in the correct way. SAP SYSTEM VS INSTANCE In SAP, an instance is a group of resources such as memory, work processes and so on, usually in support of a single application server or database server with

sapstartsrv is not started or sapcontrol is not working

 What is sapstartsrv ? The SAP start service runs on every computer where an instance of an SAP system is started. It is implemented as a service on Windows, and as a daemon on UNIX. The process is called  sapstartsrv.exe   on Windows, and   sapstartsrv   on UNIX platforms. The SAP start service provides the following functions for monitoring SAP systems, instances, and processes. Starting and stopping Monitoring the runtime state Reading logs, traces, and configuration files Technical information, such as network ports, active sessions, thread lists, etc. These services are provided on SAPControl SOAP Web Service, and used by SAP monitoring tools (SAP Management Console,  SAP NetWeaver  Administrator, etc.). For more understanding use this link : https://help.sap.com/doc/saphelp_nw73ehp1/7.31.19/enUS/b3/903925c34a45e28a2861b59c3c5623/content.htm?no_cache=true How to check if it is working or not ? In case of linux , you can simply ps -ef | grep sapstartsrv In case of windows, you need

HANA System Replication - Prerequisites & Setup

Hey Folks! Welcome back to Hana high availability blog series. In our last blog we checked out operation & replication modes in hana system replication. If you haven't gone though that blog, you can checkout  this link In this blog we will be talking about the prerequisites of hana replication and it's setup. So let's get started. When we plan to setup hana system replication, we need to make sure that all prerequisite steps have been followed. Let's have a look at these prerequisites. HANA System Replication Prerequisites: Primary & secondary systems should be up & running HDB version of secondary should be greater than or equal to Primary database sever But, for Active/Active(read enabled config), HDB version should be same on both sites. System configuration/ini files should be identical on both sides Replication happe

ST03N : The chapter for all BASIS Admins

This blog is targeted to BASIS ADMINS Transaction for workload analysis statistical data changed over time are monitored using transaction code ST03 , now ST03N (from SAP R/3 4.6C) . With SAP Web AS 6.4 the transaction ST03 is available again. From time to time ST03 and ST03N has seen many changes but later in SAP NW7.0 ST03N has reworked in detail specially processing time is now shown in separate column. Main Use of ST03N  is to get detailed information on performance of any ABAP based SAP system. Workload monitor analyzes the statistical data originally collected by kernel. You can compare or analyze the performance of a single application server or multiple application server. Using this you start checking from the entire system and finding your way to that one application server and narrowing down to exact issue. By Default :- You see data of current day as default view , you can change the default view. Source of the image : sap-perf.ca Let's discuss the WORKLOAD MONITOR By D

HANA hdbuserstore

The hdbuserstore (hana secure user store) is a tool which comes as an executable with the SAP Hana Client package. This secure user store allows you to store SAP HANA connection information, including user passwords, securely on clients. With the help of secure store, the client applications can connect to SAP HANA without the user having to enter host name or logon credentials. You can also use the secure store to configure failover support for application servers in a 3-tier scenario (for example, SAP Business Warehouse) by storing a list of all the hosts that the application server can connect to. To access the system using secure store, there are two connect options: (1)key and (2)virtualHostName. key is the hdbuserstore key that you use to connect to SAP HANA, while virtualHostName specifies the virtual host name. This option allows you to change where the hdbuserstore searches for the data and key files. Note

How to resolve Common Error : Standard Template "sap_sm.xls" missing

Hey everyone, putting forward a common error we usually face when we have “ Excel inplace” functionality enabled in our SAP system. This error occurs when validity of the signature of SAP standard templates expired or were incorrectly delivered via support packages. We can reproduce the error by doing as below.. Click on “spreadsheet” icon after any SAP ALV grid view of data is on screen to make this data to export into excel directly from SAP.

Work Process and Memory Management in SAP

Let’s talk about the entire concepts that are related to memory when we talk about SAP Application. Starting with few basic terminologies, Local Memory :  Local process memory, the operating system keeps the two allocation steps transparent. The operating system does the other tasks, such as reserving physical memory, loading and unloading virtual memory into and out of the main memory. Shared Memory :  If several processes are to access the same memory area, the two allocation steps are not transparent. One object is created that represents the physical memory and can be used by various processes. The processes can map the object fully or partially into the address space. The way this is done varies from platform to platform. Memory mapped files, unnamed mapped files, and shared memory are used.  Extended Memory : SAP extended memory is the core of the SAP memory management system. Each SAP work process has a part reserved in its virtual address space for extended memory. You can set

Complete Guide : XPI Inspector Tool

Content of this blog :           What is an XPI Inspector Tool ? Why XPI Tool is used ? XPI standard URL How to check XPI Tool version ? How to Install/Update XPI version using TELNET How to Use XPI Tool ? References – SAP Notes What is XPI Inspector tool ?          -    XPI Inspector is a diagnostics web application developed by SAP that collects logs and debug traces from various PI components in a very simple way and is useful for SAP PI consultants, developers, and administrators to get more insights on an issue. Why XPI is used  – 1.  Used to collect traces and logs from Messaging system or XI module. 2. Used to collect the related information to solving the issues or improving the PI or PO systems’ performance. 3. Using XPI Inspector application you will be able to collect a lot of information about your system that will help you to learn about problems in the past, to analyze new and detect such at an early stage. 4. Performs certain number of configuration checks, such as SSL c

SAP system migration blog series - part 1: migration overview

Summary : This blog is part 1 of the blog series on SAP system migration. In this blog, we will provide overview about SAP migration, types of migration, their differences and usage scenario. SAP migration overview :   As the Greek philosopher, Heraclitus, said: “change is the only constant.” Same goes within SAP world too, often customer have to change the SAP systems along with its underlying components to meet the changing requirements, be it change from old hardware to new one, changing operating system, database. This change in SAP system components (DB, OS or Hardware) is termed as migration. Before we go into details of migration, let’s understand architecture of a typical SAP system.   An SAP system consist of SAP application instances, running on database (DB), hosted on operating system (OS), provisioned on hardware. Change in any one or more of these underlying components (DB, OS or hardware) warrant us to perform migration. Types of migration:   Broadly, there are two types

ABAP Dumps Analysis

Ever now and then have you heard about ABAP Dumps, We also have a joke everything in temporary in life except ABAP dumps for SAP Consultants. Lets try to understand ABAP dumps from perspective of a SAP BASIS Consultant. Dumps happen when an ABAP program runs and something goes wrong that cannot be handled by the program We have two broad categories of Dumps , In custom program Dumps and SAP provided program Dumps. Dumps that happen in the customer namespace ranges (i.e. own-developed code) or known as Custom Program , can usually be fixed by the ABAP programmer of your team. Dumps that happen in SAP standard code probably need a fix from SAP. You do not have to be an "ABAPer" in order to resolve ABAP dump issues. The common way to deal with them is to look up in ST22 How to correct the error ? Hints are given for the keywords that may be used to search on the note system. Gather Information about the issue  Go to System > Status and Check the Basis SP level as well as info